Don't pay just to turn a CSV into a chart.
Use Chart Studio, built with RAWGraphs, to map your columns, make a chart, and keep both editable data and editable vectors. No account or subscription. If you would pay for Datawrapper Pro just to export editable SVG, try this free RAWGraphs workflow. Datawrapper already offers free interactive publishing and PNG downloads; Pro adds SVG/PDF export. This is a static chart-authoring alternative, not a replacement for hosted interactive embeds, maps or team controls. Check current Datawrapper plans.
Follow the first-chart recipe · Read the limits · Source and credits
Open the full chart editor
The mature RAWGraphs interface includes 32 chart definitions. Desktop-sized screens work best. Start with the small sample below and save your work before closing.
Your files stay in the isolated editor. No automatic backup or cloud saving.
Your first reusable chart
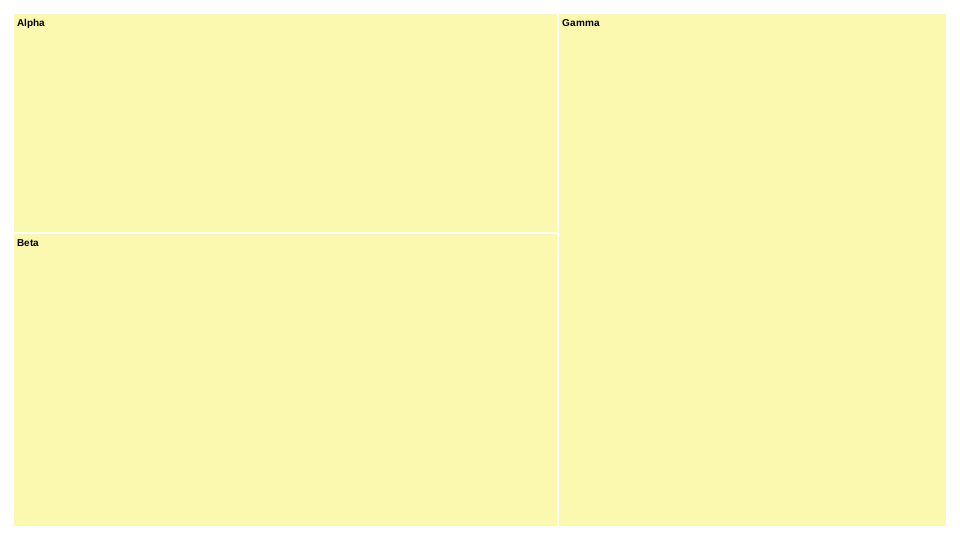
Practice with a tiny fictional allocation: Alpha 3, Beta 4, Gamma 5, total 12. The rectangles should be sized in that ratio. The original CSV stays useful even if you later change tools.
- Load: open the editor, choose “Open a data file”, and select sample.csv. Check three rows and the columns parent, leaf and value. Value should be numeric; choose comma as the separator if the table looks wrong.
- Choose: select Treemap. Map parent and then leaf to Hierarchy, value to Size, and leaf to Label. Keep Sum for size. Alpha, Beta and Gamma are short labels chosen to fit this example.
- Style: set the artboard to 960 × 540. Make labels dark and cells light; select “Spectral discrete” in Color scheme for a pale-yellow singleton fill like the example. If an older saved project looks black-on-black, explicitly choose a readable palette. Saved colors are not automatically changed.
- Keep your work: in “5. Save or export”, set Filename to first-chart. Select “RAWGraphs · editable project + data” then Download. Also select “SVG · editable vectors” and Download. Open both saved files to check they exist. The SVG is for vector editors; only the .rawgraphs project reopens with data and mappings.
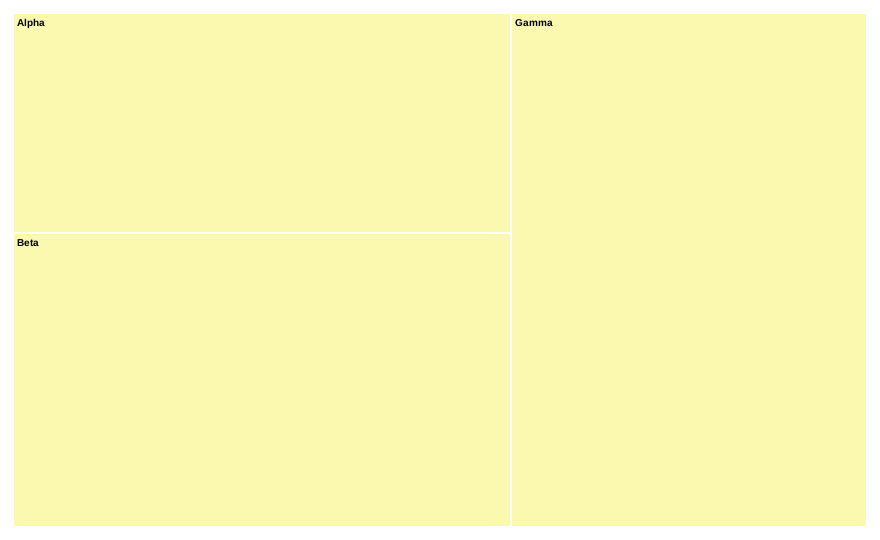
- Reopen and revise: keep the original project safe, open this page in a fresh tab, launch the editor, choose “Open your project”, and select first-chart.rawgraphs. Check the three labels and proportions, then change width to 880. Download as first-chart-revised.rawgraphs and first-chart-revised.svg.
- Confirm: reopen the revised project in another fresh editor. It should still be 880 × 540 with the same data. Compare the supplied original and revised examples below. You now have an editable project, a revised project, and vectors you can continue editing in a free editor such as Inkscape.
Shortcut: open the ready-mapped project instead of mapping from scratch, then follow steps 4–6. This uses the same real project format, not a separate toy editor.
Useful, with honest limits
- The bundled app compiled successfully. Core/renderer save, reopen and width-revision tests passed for this example. Browser editing, file opening and downloads remain unverified. Real React lifecycle acceptance is also unverified. If a browser doesn't download, keep the original data and do not assume your work was saved.
- Long labels can clip or overlap in some horizon, line, slope and treemap designs. Inspect your SVG at its final size. Increase margins, shorten labels or choose another chart; this is not an automatic readability guarantee.
- Repeated imports into an existing editor and PNG/JPEG export are not qualified here. Prefer a fresh editor for reopening. Mobile/touch, screen-reader use and every chart/data combination have not been accepted.
- Maximum input is 5 MB; projects 20 MB; 50,000 rows, 256 columns and 200,000 cells. Complex charts can be slow before these limits. There is no remote dataset loading, custom chart code, account, cloud sync or collaborative editing.
- Projects contain the data you imported. Share them deliberately. Hosting requests still occur to load this page; no analytics or upload backend is added. The editor is sandboxed away from the Hub's storage, with network requests disabled by policy.
Keep the source, too
Independent RAWGraphs adaptation. Credit to DensityDesign, Calibro, INMAGIK and all upstream contributors. Apache-2.0 application; dependencies retain their licences. The source ZIP includes the unmodified compiled candidate, full app source, pinned lockfile and this wrapper.
Download source and integration ZIP · Apache-2.0 licence · Dependency notices · Supplemental notices · Build notes and limits · Official RAWGraphs
Calendar package licence is declared Apache-2.0; separate original NOTICE provenance remains unverified. No missing required notice has been demonstrated. This is not official RAWGraphs endorsement or a legal-clearance certificate.